Moon Viewing Calendar
January 2026
Optimal Moon Viewing Calendar
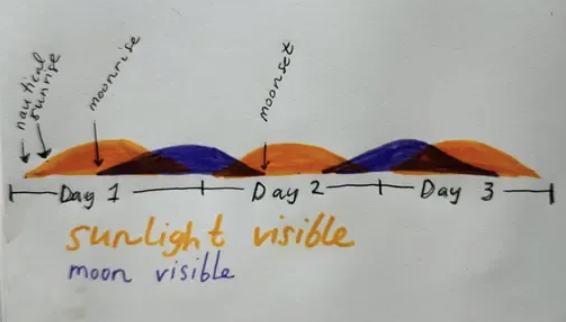
Have you ever wondered why you can seen a cresent moon in the sky in the middle of the day, but the full moon always appears in the night? I wanted to visualize the long cycles of the moon and sun as a handy quick reference guide for optimal moon-viewing. I drew out a sketch for the kind of chart that might serve this purpose and found an astronomy library for python (astropy) that I used for sun and moon height data. This instance charts a moon viewing calendar for Portland, Oregon, but any latitude, longitude can easily be used as input.
Moon Viewing Calendar
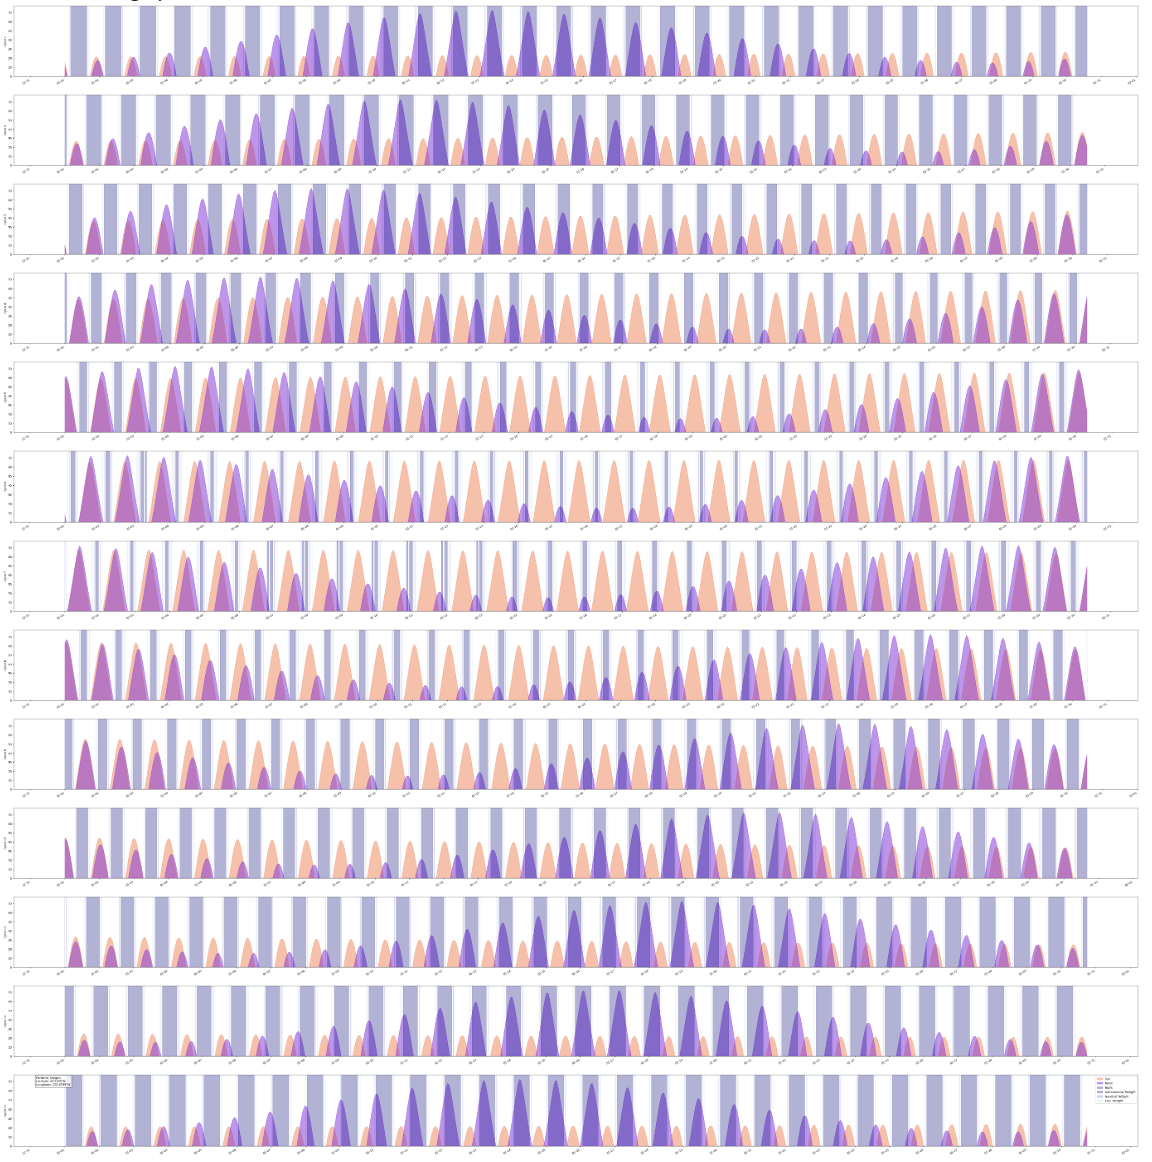
Each row charts one cycle new moon to new moon, the sun height in the sky is in gold and moon height in purple and the nights are represented by blue-grey bands.
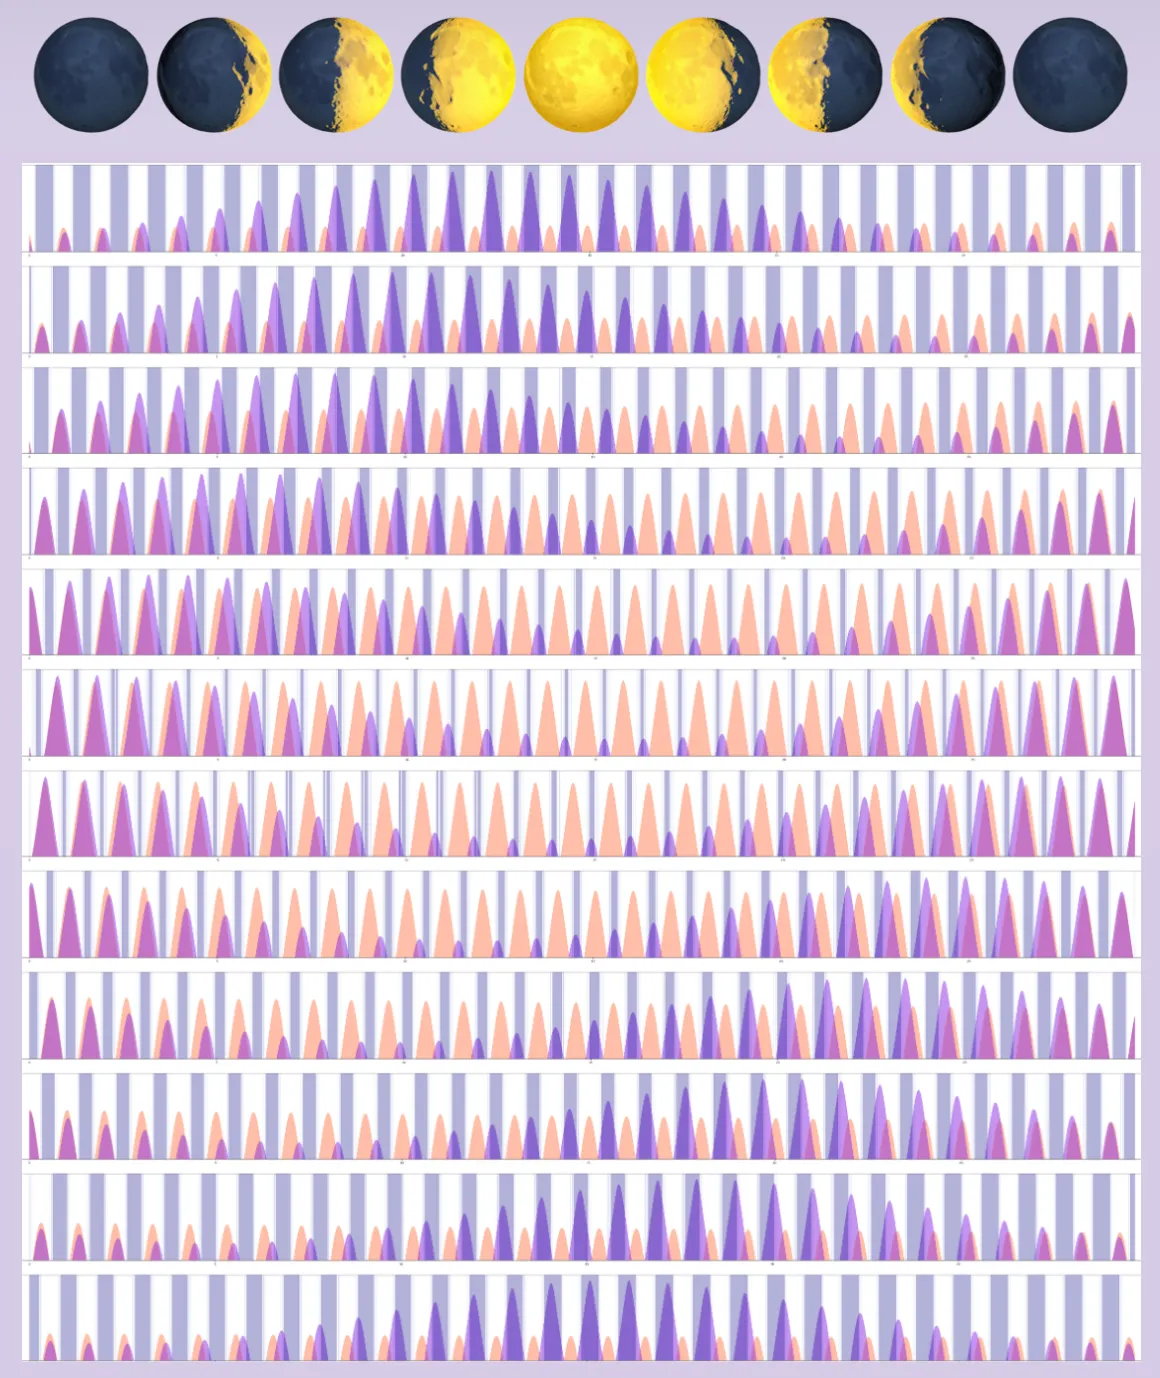
What I love about this graphic is the you can clearly see seasonal trends and cycles. I can get an over view of the information from a distance. And then zooming in, I can get very specific information about when is the best time of day to view the moon. I don't think there is a need for labels, though in a larger image there are dates visible, for conveniece.
Original sketch for the moon-viewing calendar
Code
import ephem
from astropy.time import Time
from astropy.coordinates import get_moon, get_sun, AltAz, EarthLocation
import astropy.units as u
from datetime import timedelta
import matplotlib.dates as mdates
import numpy as np
import matplotlib.pyplot as plt
from tqdm import tqdm

def calculate_moon_phase(date):
    moon = ephem.Moon()
    moon.compute(date)
    return moon.phase / 100.0

def find_new_moons(start_date, end_date):
    new_moons = []
    current = ephem.Date(start_date.datetime)
    end = ephem.Date(end_date.datetime)

    while current < end:
        next_new = ephem.next_new_moon(current)
        if next_new > end:
            break
        new_moons.append(Time(ephem.Date(next_new).datetime()))
        current = ephem.Date(next_new + 1)
    return new_moons

def calculate_cycle_data(cycle_start, cycle_end, location):
    hours_total = int((cycle_end - cycle_start).jd * 24)
    times = [cycle_start + timedelta(hours=h) for h in range(hours_total)]
    times = Time(times)

    moon_altitudes = []
    sun_altitudes = []
    moon_phases = []

    for t in times:
        moon = get_moon(t)
        moon_altaz = moon.transform_to(AltAz(obstime=t, location=location))
        moon_altitudes.append(moon_altaz.alt.degree)

        sun = get_sun(t)
        sun_altaz = sun.transform_to(AltAz(obstime=t, location=location))
        sun_altitudes.append(sun_altaz.alt.degree)

        moon_phases.append(calculate_moon_phase(t.datetime))

    days = np.linspace(0, len(times)/24, len(times))
    return days, sun_altitudes, moon_altitudes, moon_phases

def plot_cycle(days, sun_altitudes, moon_altitudes, cycle_num, latitude, longitude):
    plt.figure(figsize=(70, 5))

    plt.fill_between(days, 0, sun_altitudes, color='coral', alpha=0.5, label='Sun')
    plt.fill_between(days, 0, moon_altitudes, color='blueviolet', alpha=0.5, label='Moon')

    plt.plot(days, sun_altitudes, 'coral', linewidth=1, alpha=0.5)
    plt.plot(days, moon_altitudes, 'blueviolet', linewidth=1, alpha=0.5)

    y_max = max(max([max(0, alt) for alt in sun_altitudes]),
               max([max(0, alt) for alt in moon_altitudes])) + 5

    # Add twilight bands
    plt.fill_between(days, 0, y_max,
                    where=[alt <= -18 for alt in sun_altitudes],
                    color='navy', alpha=0.3, label='Night')

    plt.fill_between(days, 0, y_max,
                    where=[(-18 <= alt <= -12) for alt in sun_altitudes],
                    color='darkblue', alpha=0.3, label='Astronomical Twilight')

    plt.fill_between(days, 0, y_max,
                    where=[(-12 <= alt <= -6) for alt in sun_altitudes],
                    color='royalblue', alpha=0.3, label='Nautical Twilight')

    plt.fill_between(days, 0, y_max,
                    where=[(-6 <= alt <= 0) for alt in sun_altitudes],
                    color='lightblue', alpha=0.3, label='Civil Twilight')
    plt.gca().xaxis.set_major_formatter(mdates.DateFormatter('%m-%d'))
    plt.gca().xaxis.set_major_locator(mdates.DayLocator())

    plt.gcf().autofmt_xdate()
    plt.ylabel(f'Cycle {cycle_num + 1}')
    plt.ylim(0, y_max)

def plot_sun_moon(latitude, longitude):
    location = EarthLocation(lat=latitude * u.deg, lon=longitude * u.deg)

    start_date = Time('2026-12-20 00:00:00')
    end_date = Time('2027-01-20 00:00:00')
    new_moons = find_new_moons(start_date, end_date)

    n_cycles = len(new_moons) - 1
    print(f"Calculating Sun and Moon positions for {n_cycles} lunar cycles...")

    # Calculate all cycle data first
    cycle_data = []
    for cycle in range(n_cycles):
        cycle_start = new_moons[cycle]
        cycle_end = new_moons[cycle + 1]
        with tqdm(desc=f"Calculating cycle {cycle + 1}/{n_cycles}"):
            data = calculate_cycle_data(cycle_start, cycle_end, location)
            cycle_data.append(data)

    # Plot all cycles
    print("Generating plots...")
    for cycle, (days, sun_altitudes, moon_altitudes, moon_phases) in enumerate(cycle_data):
        plot_cycle(days, sun_altitudes, moon_altitudes, cycle, latitude, longitude)
    info_text = f"Portland, Oregon \nLatitude: {latitude}°N\nLongitude: {abs(longitude)}°W"
    plt.text(0.02, 0.98, info_text, transform=plt.gca().transAxes,
            verticalalignment='top', bbox=dict(facecolor='white', alpha=0.8))

    plt.legend()
    plt.show()

# Portland, Oregon
latitude = 45.5155
longitude = -122.6789

plot_sun_moon(latitude, longitude)