AI User Adoption Strategy Consulting
February 2026
AI System Audit
For my graduate capstone project for my MS degree, I led a student team that performed an audit on the internal AI system for a F500 regional energy company. This project was under NDA, so I can't share the data or most specifics of the project. But I can share some of the data visualizations based on our analysis of survey data.
Data Storytelling
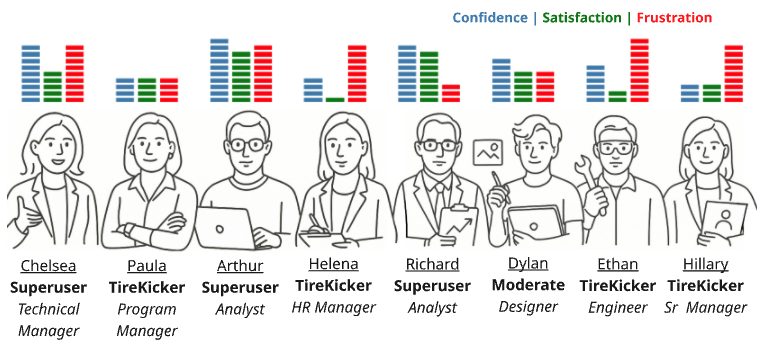 I made this user persona graphic for our final presentation. It was based on data gathered in our VOC interviews, and informed by our company-wide survey. For the Confidence, Satisfaction and Frustration score graphs, I used data from our VOC interviews and made the charts in python.
I drew this quick mockup on my ipad (below) during a planning meeting for our final presentation. My team was able to immediatly refine the concept in our meeting, and based on this initial scketch, I made the final graphic. The user portrait line drawings were made with my initial ipad sketches, fed into AI image gen with more digital painting for details and clean-up.

Python Code for Bar Charts
   import matplotlib.pyplot as plt
   import pandas as pd
   import matplotlib.patches as patches

   # Data
   data = {
       "Alias": ["Arthur", "Chelsea", "Dylan", "Ethan", "Helena", "Hillary", "Paula", "Richard"],
       "Confidence": [10, 9, 7, 6, 4, 3, 4, 9],
       "Satisfaction": [8, 5, 5, 2, 1, 3, 4, 8],
       "Frustration": [9, 9, 5, 10, 9, 9, 4, 3],
   }

   df = pd.DataFrame(data)

   # Function to create a vertical progress bar
   def draw_progress_bar(ax, x, value, color):
       bar_height = 0.15
       bar_width = 0.6
       max_value = 10
       for i in range(max_value):
           rect = patches.Rectangle((x, 0.15 + i * bar_height), bar_width, bar_height - 0.03,
                                   linewidth=1, edgecolor='white',
                                   facecolor=color if i < value else 'white')
           ax.add_patch(rect)

   # Create the figure
   fig, ax = plt.subplots(figsize=(12, 6))
   ax.set_xlim(0, len(df) * 3)
   ax.set_ylim(0, 8.5)
   ax.axis('off')

   # Colors
   colors = {
       "Confidence": "steelblue",
       "Satisfaction": "green",
       "Frustration": "red",
   }

   # Plot progress bars with added spacing between bars
   for idx, row in df.iterrows():
       x_base = idx * 3
       draw_progress_bar(ax, x_base, row["Confidence"], colors["Confidence"])
       draw_progress_bar(ax, x_base + 0.7, row["Satisfaction"], colors["Satisfaction"])
       draw_progress_bar(ax, x_base + 1.4, row["Frustration"], colors["Frustration"])

   plt.tight_layout()
   plt.show()