ASK-PPD
April 2026
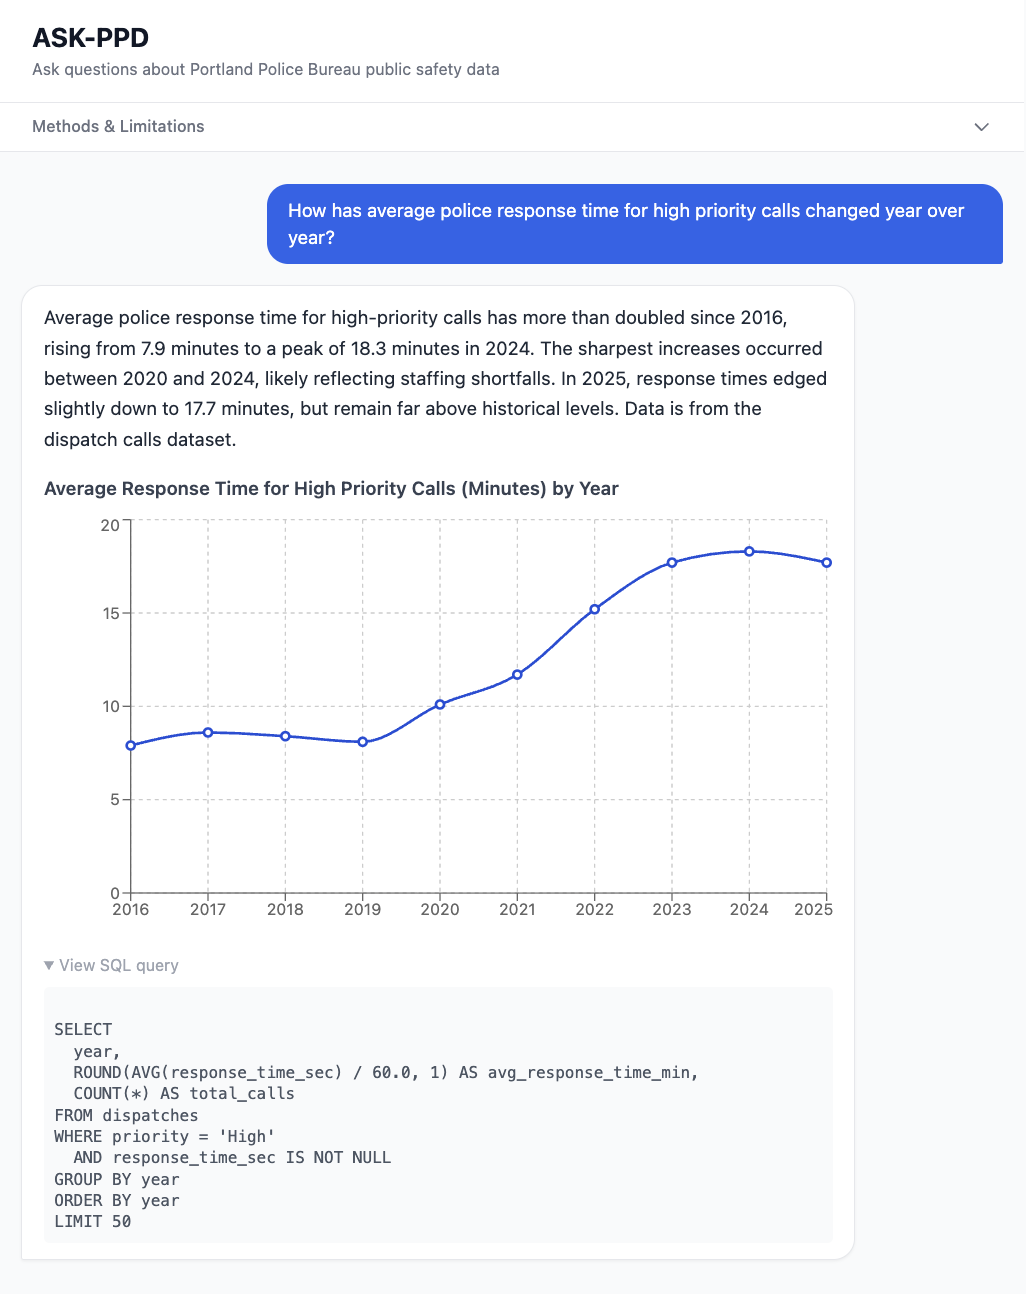
Screen view of the app:
Deployed live at ASK-PPD
Overview
ASK-PPD makes 10 years of Portland Police Bureau open data accessible to anyone who can type a question. Ask something like "which neighborhoods have the slowest police response times?" or "how has motor vehicle theft trended since 2015?" and get a plain-English answer with a supporting chart — no SQL or data skills required.
The problem it solves
Portland's public safety data is technically open but practically inaccessible. The PPB publishes crime and dispatch data through Tableau dashboards that require users to already know what they're looking for, understand how to filter datasets, and interpret statistical context on their own. Most residents, journalists, and researchers can't or won't do this. ASK-PPD removes that barrier entirely.
Data
The app queries two PPB open datasets ingested into a local SQLite database:
- 670,000+ reported crime incidents (2015–2026): offense type, neighborhood, council district, date and location
- 2.3 million 911 dispatched calls for service (2016–2026): call type, priority level, neighborhood, and full response time breakdown (time in queue, travel time, total response time)
Data was downloaded from the PPB open data portal, cleaned and normalized using Python and pandas, and loaded into SQLite with indexed columns for query performance.
How it works
The app uses a two-step LLM chain implementing a SQL-based RAG pattern: Step 1 — Text-to-SQL: The user's question is sent to the Claude API with a detailed schema description. Claude generates a SQLite SELECT query tailored to the question. Step 2 — Analysis: The query executes against the real database. The results are passed back to Claude, which interprets them into a plain-English answer and chart, if relevant to the question. Every number in a response comes from a live database query, not from the model's training data. This architecture significantly reduces hallucination risk compared to asking an LLM a data question directly. The SQL query behind each answer is shown in a dropdown in the UI so users can verify the logic themselves.
Tech stack
Next.js, SQLite, better-sqlite3, Anthropic Claude API (claude-sonnet), Recharts, Tailwind CSS, Python, pandas. Built and scaffolded using Claude Code.
Known limitations
- Reflects reported incidents, not actual crime. Unreported crime is not captured.
- Policing patterns affect what gets reported and where
- No population normalization, so high foot traffic areas like downtown may appear more dangerous than resident population figures suggest
- Natural language to SQL has failure modes — complex or ambiguous questions may produce inaccurate queries.
Research context
A 2024 peer-reviewed paper, "Evaluating Large Language Models in Interaction with Open Government Data" by Maslaris et al. (PCI '24), studies LLMs as a natural language interface to government open data using a similar pattern, validating this as a meaningful area of applied research. This project and technique is interesting to me because it makes complicated civic datasets more accessible to a varied audience. Clearly
Testing
I wrote benchmarking tests for this project, but they turned out to be much more expensive to run than the resources I have to invest in this project. Included SQL for simple LLM text-to-SQL evaluation.
What I'd build next
- Population normalization using PSU neighborhood estimates for per capita crime rates
- Log every request and build a real eval dataset from production traffic
- Self-correcting SQL: feed query errors back to Claude for automatic retry
- Map view using the PPB police districts GeoJSON